Dynamic Visualizations
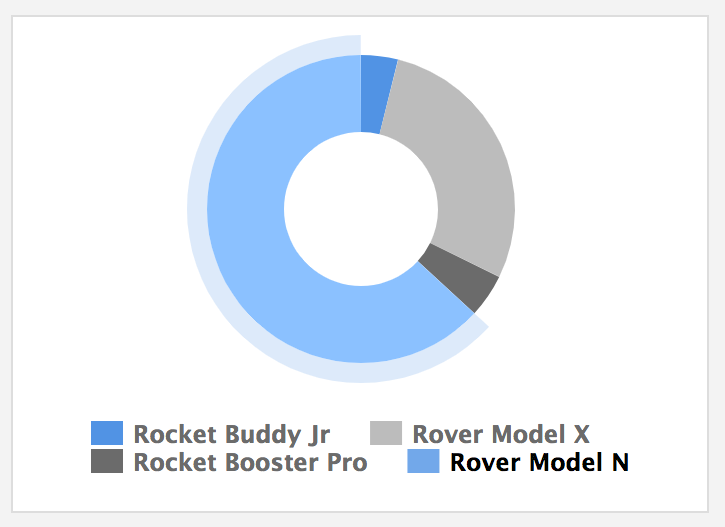
Dynamic Visualizations allow you to build elements from raw data. We connect this chart to the Example data source and select Sold as the value. The wedges are set to use Products.
Tap to play video
This builds a chart of the number of products sold. We can see that the most sales were of the Rover Model N
Dynamically Filtering
On the view page for this visualization you can filter the data to adjust the chart. Here we select only the data for a given year to see the relative sales of each product for that year.
Tap to play video
Try Visual.is for Free!