The most productive online tool for charts, graphs and dashboards.
The most productive online tool for charts, graphs and dashboards.
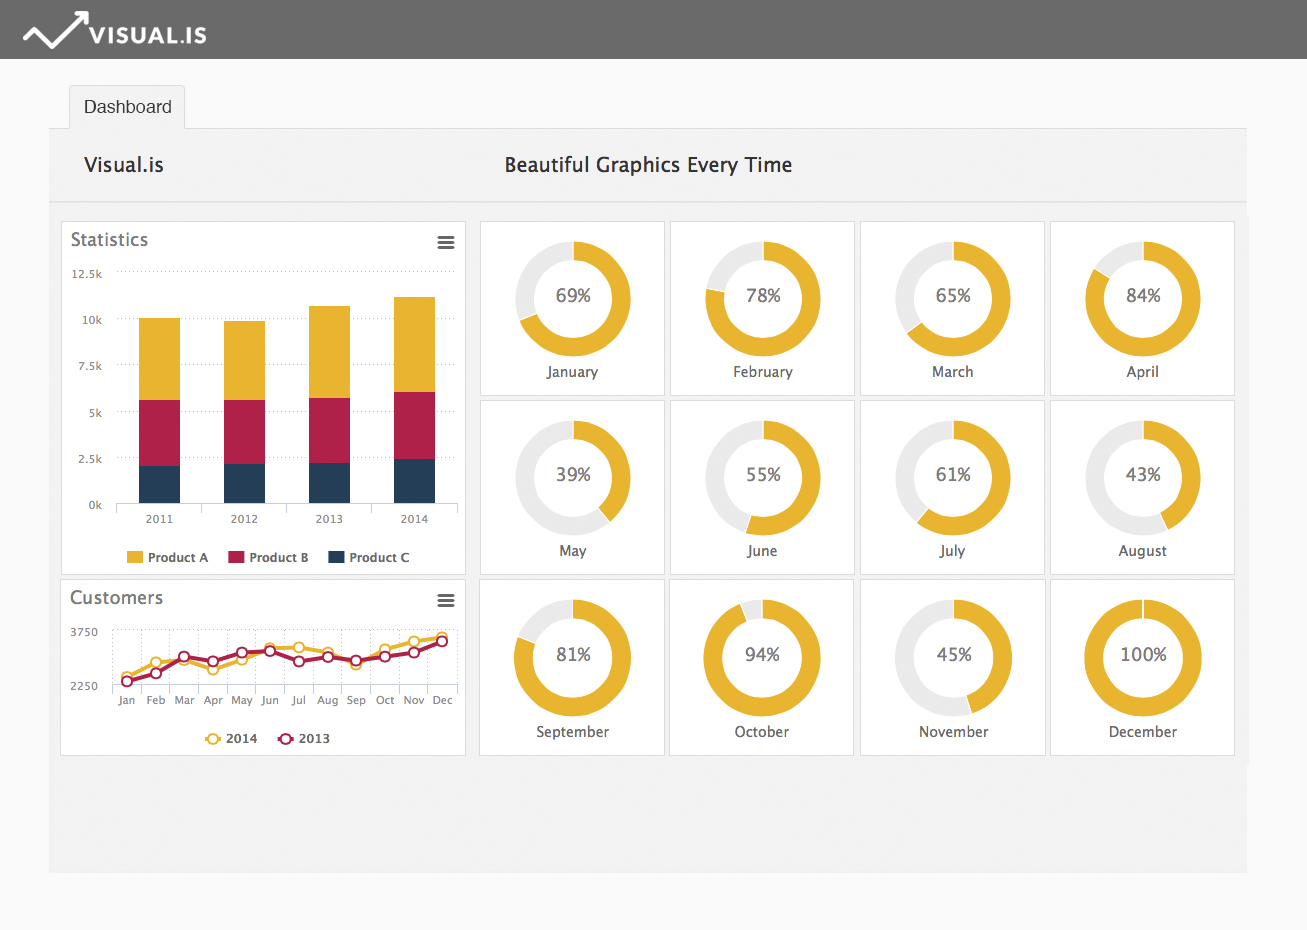
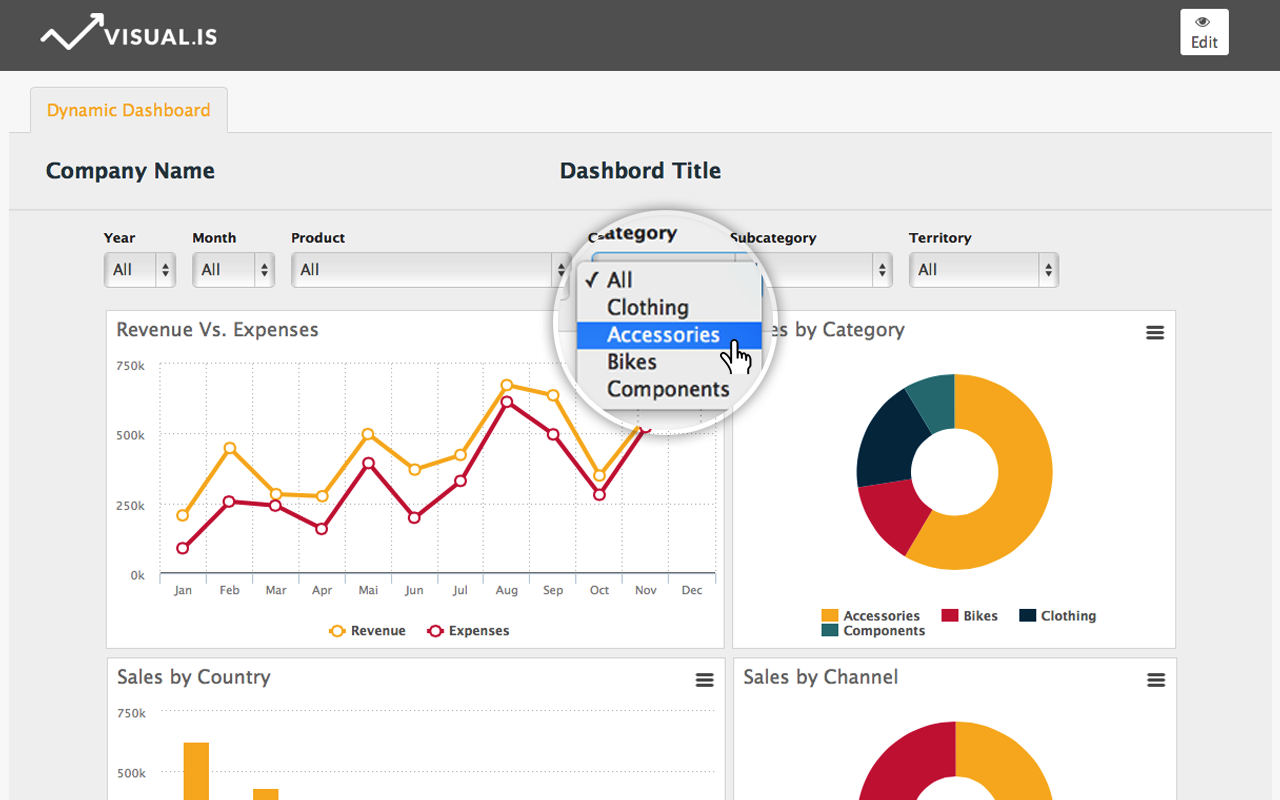
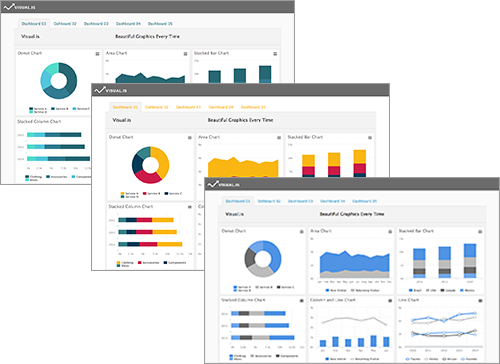
Online Dashboard Creator
Create an online dashboard that allows you to control all of the features of your business. Keep all of your data organized, and quickly access the tools needed to the left of the page. Access widgets, text, data, filters, charts, gauges and share buttons all in one place.
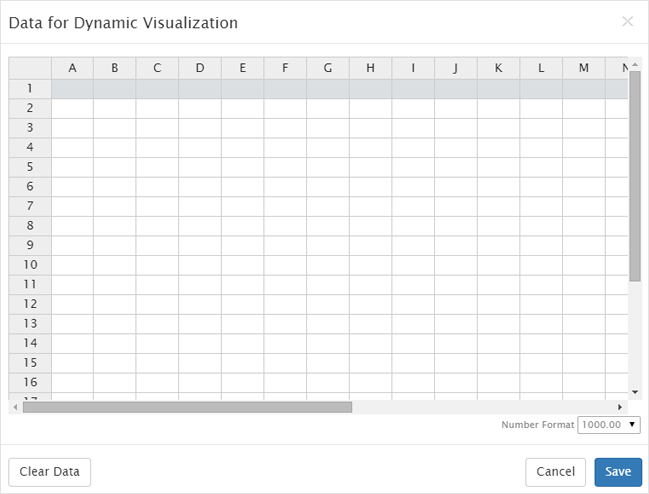
Data Management
Manage all of your data within one easy to access place. Enter your data manually to stay in control, or copy and paste the data from another spreadsheet like Excel or Google Spreadsheets and use charts, graphs or plain data records to read out the data that your company has.
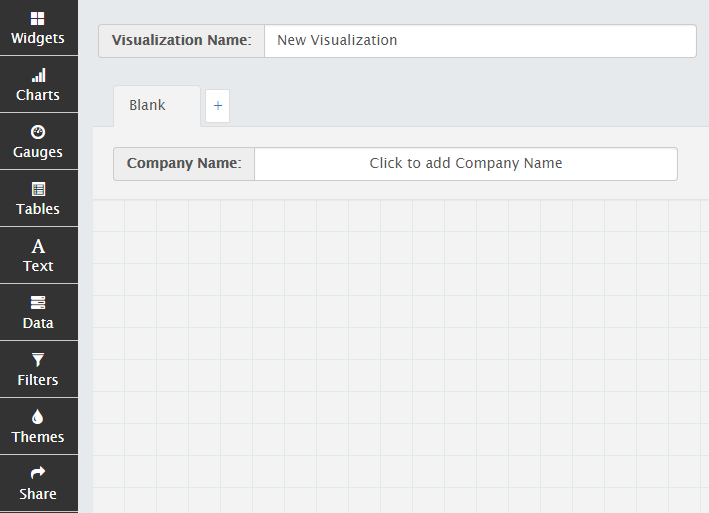
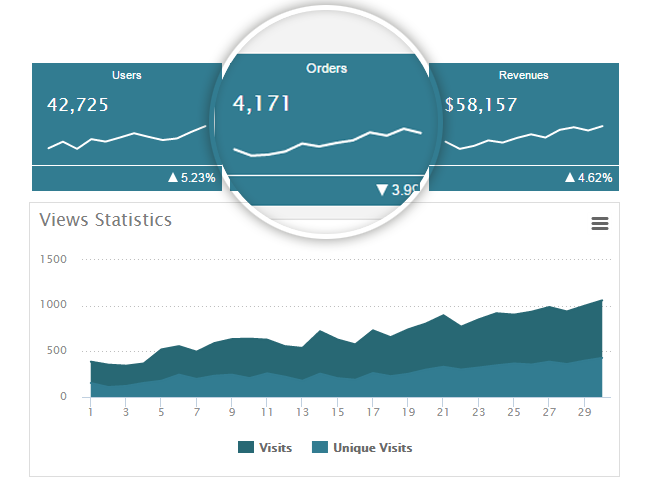
Widgets
Add widgets to your dashboard, or to any of the charts or graphs that you’re putting together. There are many to choose from, each with their own unique use. Use widgets to your advantage to highlight KPI’s and important numbers from your data.
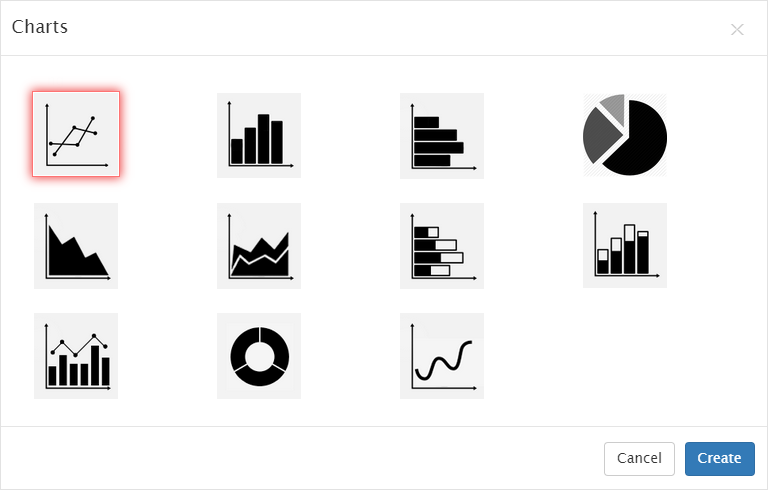
Multiple Chart Options
Choose from a wide variety of charts.
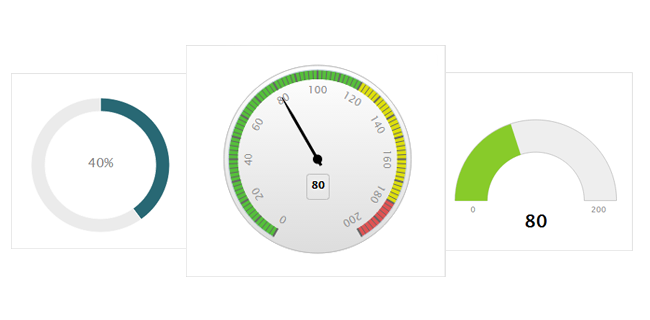
Gauges
Have a quick, easy to read representation of the data that is on your system using the gauges provided. Easily access the information in more depth, or just quickly peek at the information as it currently stands.
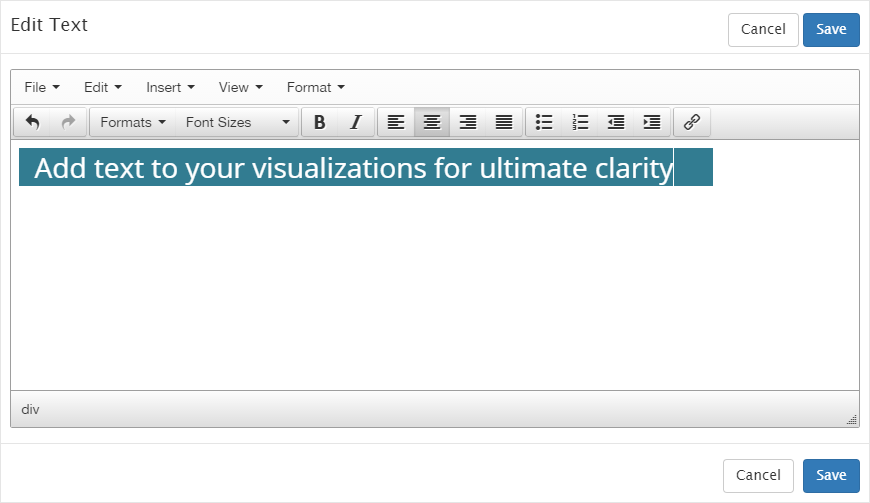
Add Text
Place your text in the dashboard to stay organized. Include notes, or correct text when necessary. Obtain clarity when you’re in control of the text on the dashboard, allowing you to add the necessary words to visualizations you create.
Filters
Filter the necessary content that you need to show for presentations to ensure that clear views of all content is presented in an effective manner. Filter information with ease when showing graphs with specific data on them, as compared to showing all of the data at once.
Themes
Choose a stunning, professional color scheme in one click. The pre-designed themes were all made by expert designers, providing a sleek, clean look when presenting the data that you have in your charts or graphs. Create a look that fits your needs, wants and has an appealing taste to it to match your company’s needs.
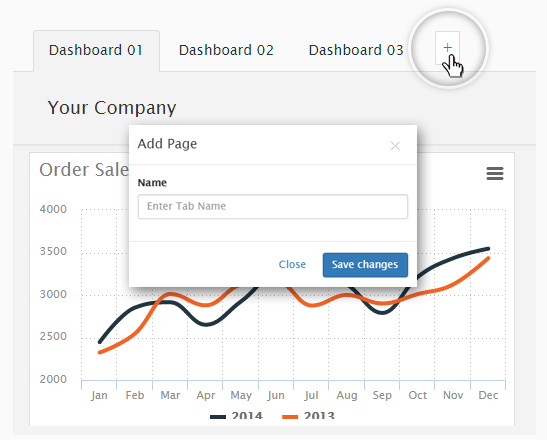
Multiple pages
Create multiple, high quality pages with graphs and charts, complete with the necessary data. Have a page for all types of data that runs through your business, and a way to access that data through the dashboard.
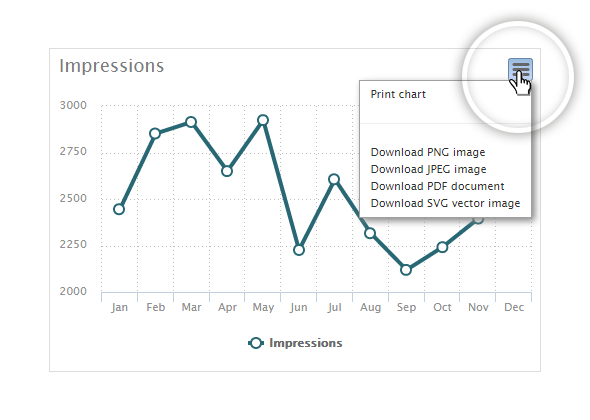
Download Charts
Easily download the charts that you make through the program to your computer for multiple uses. Back them up, or use them for presentations or reports, on websites or to share, or email to those that you know through this unique feature.
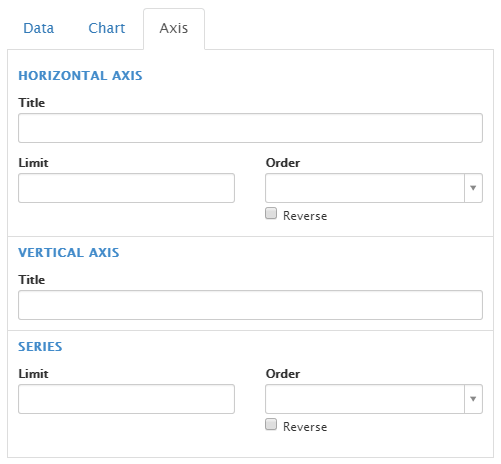
Order and limit data
Stay organized and on top of your data with the order and limit data tool that helps you re-organize, remove, add or limit the amount of data that is seen on each of the charts. Order and limit the data that is shown on each of the graphs and charts that are created for your data, as well through the use of the easy to use tool.
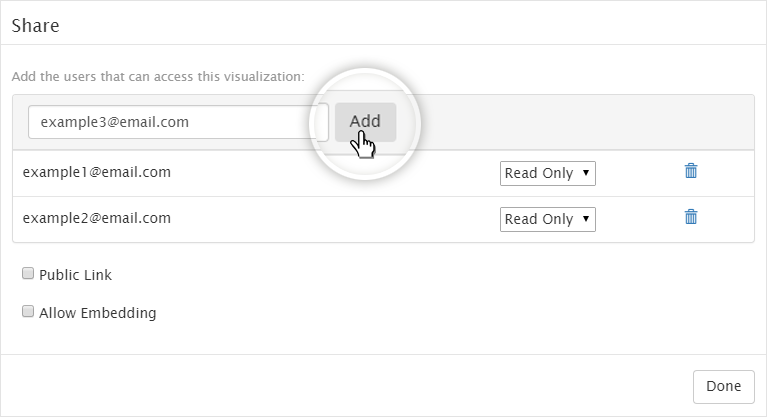
Share Results with One Click
Share your data with those around you using just one click. Everyone is able to enjoy the data that your company puts together with ease, and can help with company presentations and meetings when company data should be presented to the members.
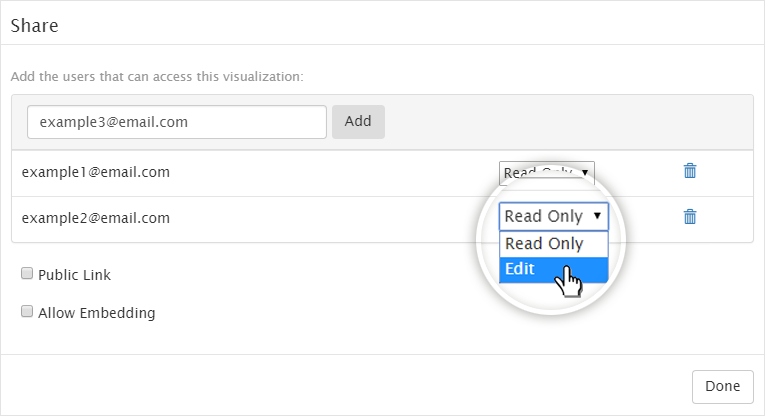
Allow other users to change your visualization
Give access to shareholders, clients, business partners and others through your dashboard. Allow them to view the dashboard, make changes and save the changes through one area. There are two versions, “Read Only” and “Edit” for the business person to share with others. Make work more dynamic and allow others to have the ability to change, edit, remove or add additional data to your charts and graphs.
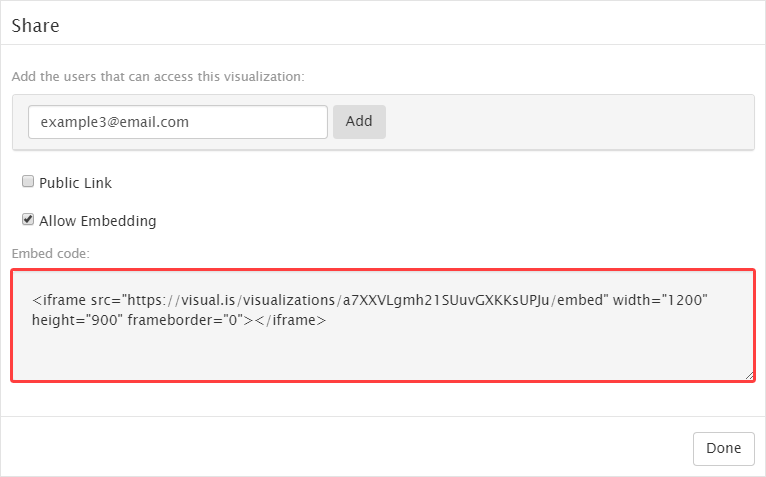
Embed code
Insert dynamics charts and dashboards to your website or blog through the use of the embed code option. Just copy and paste the code generated by visual.is and use it on your HTML page. If something is changed on your Visual.IS dashboard, your HTML page will automatically be updated with these changes as the data changes.
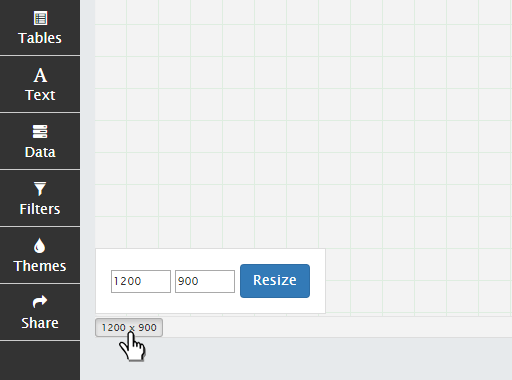
Resize Canvas
Don’t distract users from the data that you want to showcase. Resize the canvas to fit within the area, so only your data, chart and graph shows. Resize to make it larger or smaller, so that you have a perfectly put together graph of data that is easy to read and well formatted.
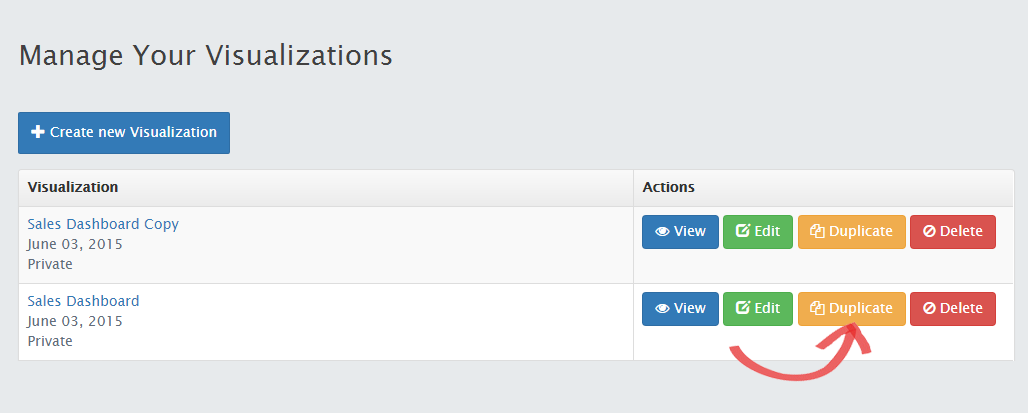
Duplicate Visualizations
Work on charts and graphs easier, and more efficiently when you use the duplicate visualization feature. With this feature, you can create a dashboard for each seller, product or other data that you wish to keep track of. You can then duplicate the first dashboard that was made and switch out the data for the next. Through the use of this tool, you’re able to be more effective with the data driven numbers into each of the graphs or charts you’re making.