Getting Started
Signing up for Visual.is is free, and we just need your email address.
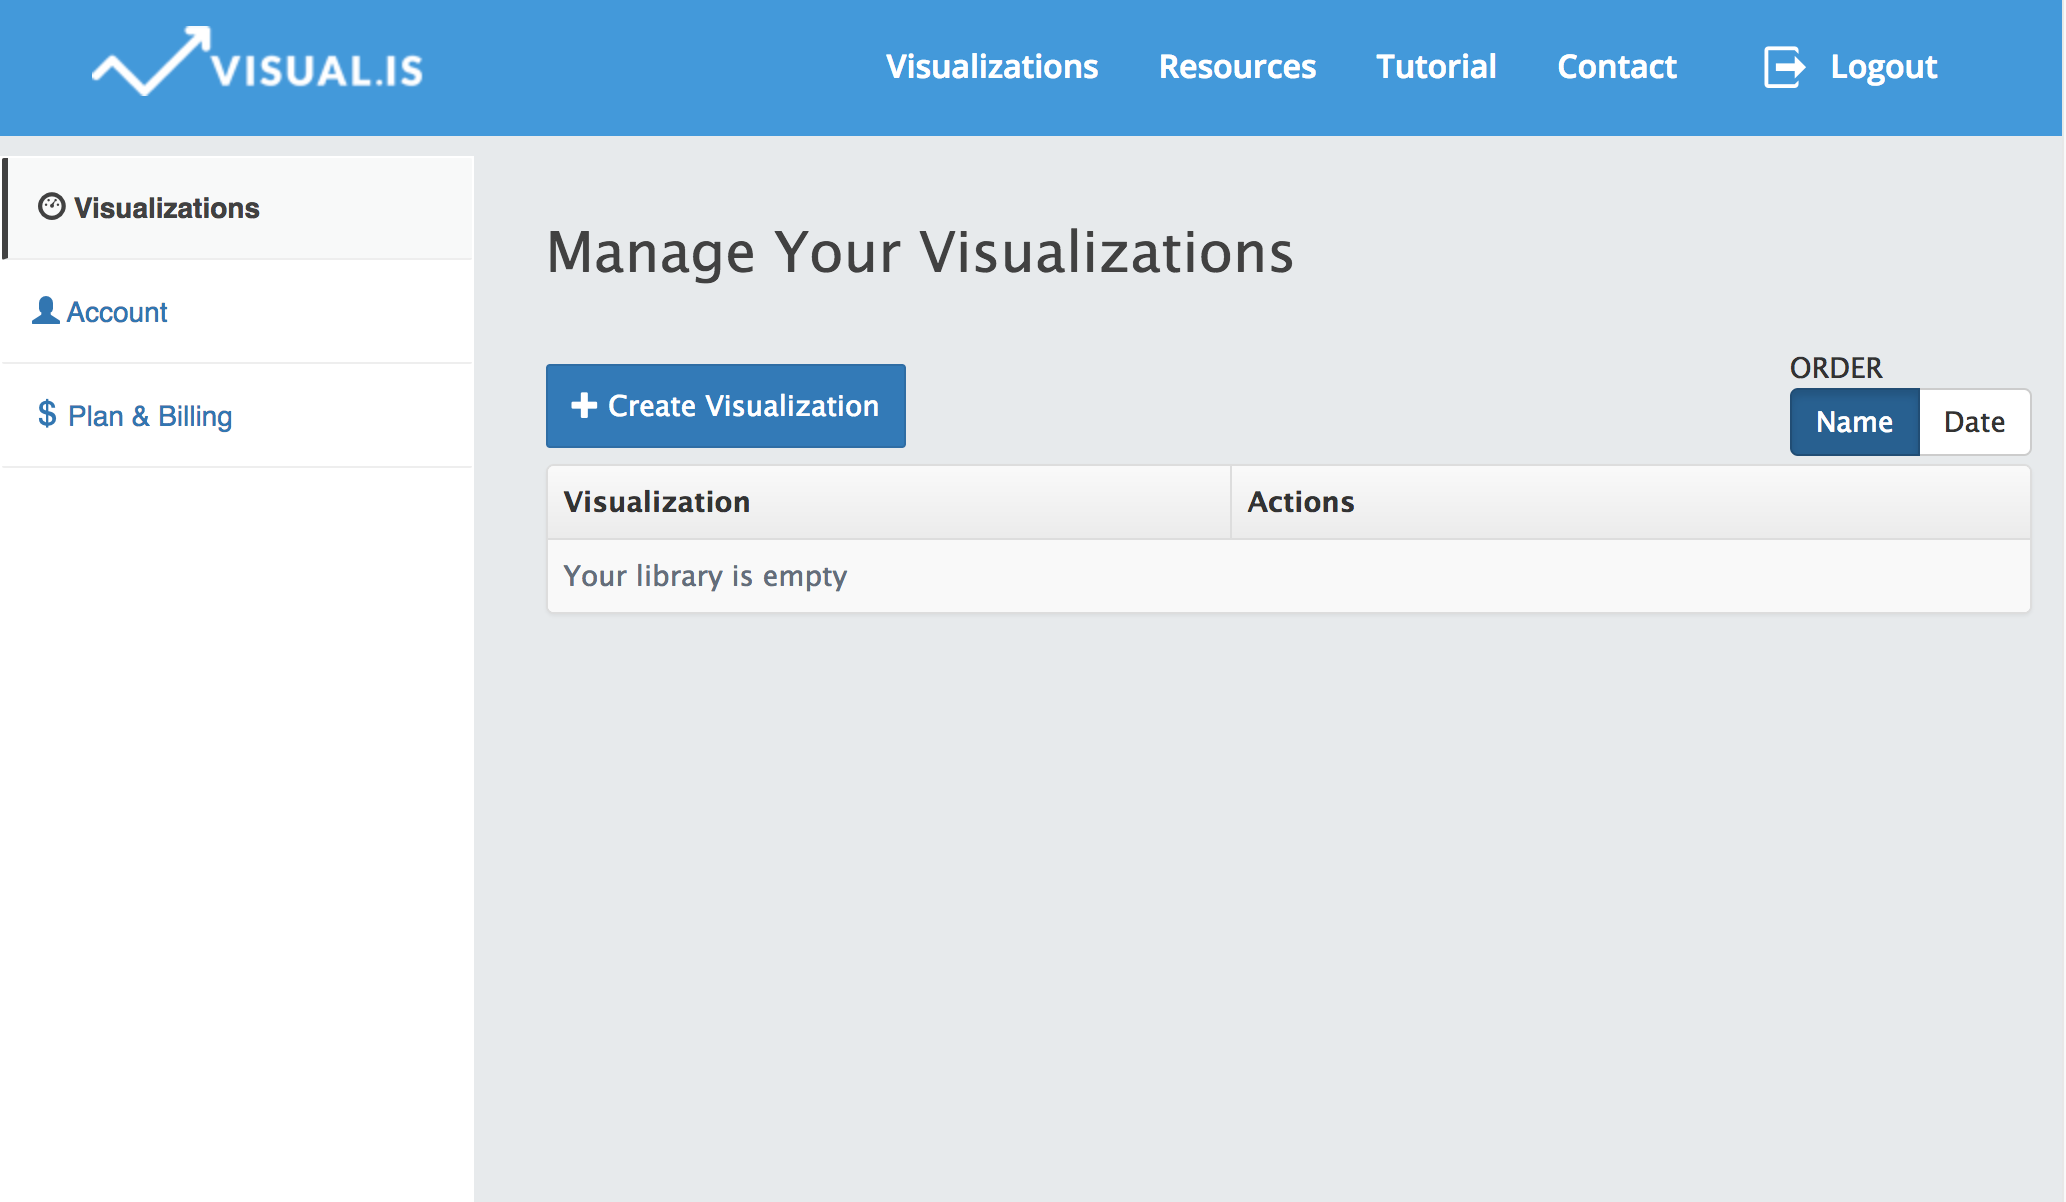
Sign up for Visual.isOnce you have sign in, the first page you'll see is the Visualization Library. On this page you'll find a list of all the visualizations you've created or had shared with you.
To create a new visualization, click the button Create Visualization.
Visualization Editor
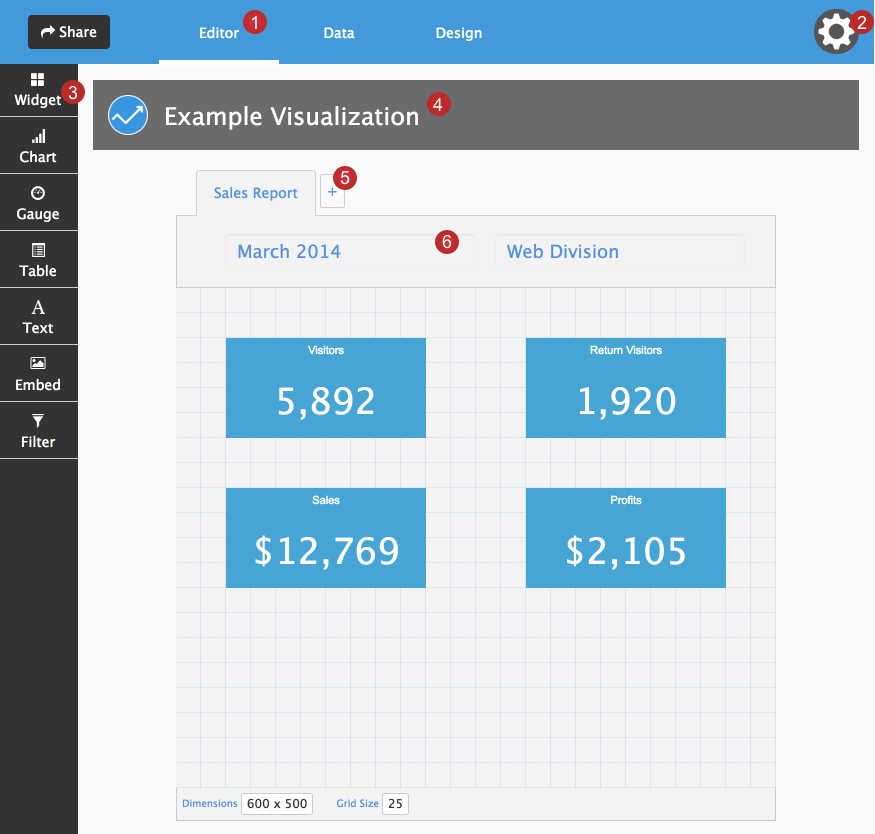
The Editor is the first of three sections for building your visualizations. It allows you to create and edit visualization elements, like Charts.
- The navigation tabs let you switch between the Editor, Data and Design sections.
- The menu has links to your visualization library and to view your visualization.
- Select from a variety of visualization elements in the sidebar, like widgets and charts.
- Here you can choose a name for your visualization. When you're finished, press enter to save the information.
- You can create more pages within the same visualization by pressing the '+' symbol next to the tab.
- The toolbar allows you to easily add additional information to each tab, like a report name, or time period.
 Try Visual.is for Free!