Chart Settings
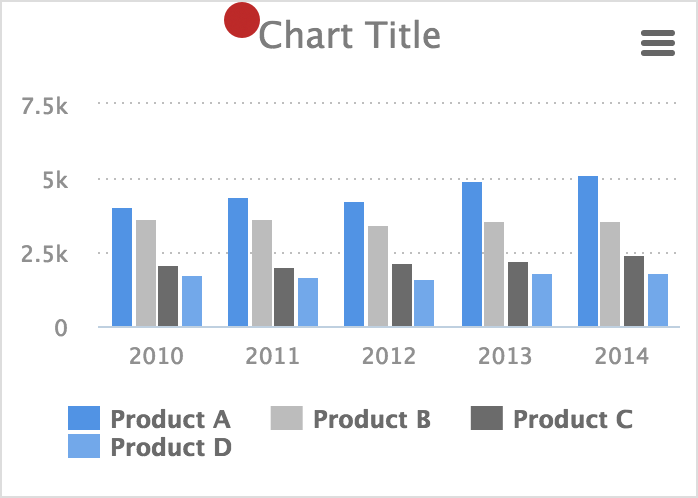
Title
The chart title appears at the top of the chart, when present.
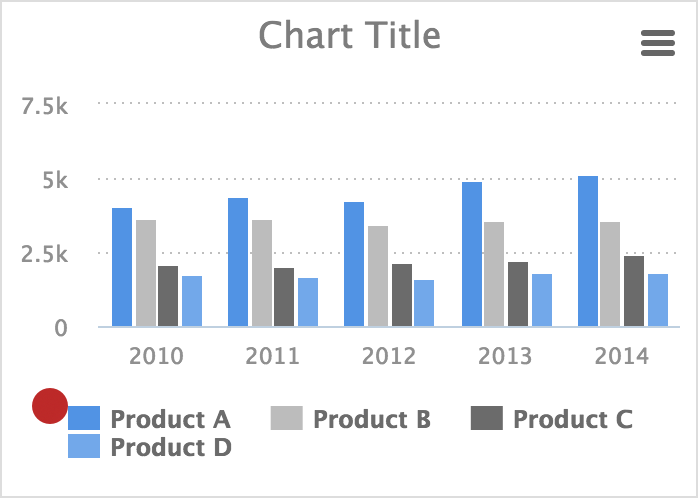
Legend
The chart legend shows all the series in the chart. It can be toggled visible or hidden.
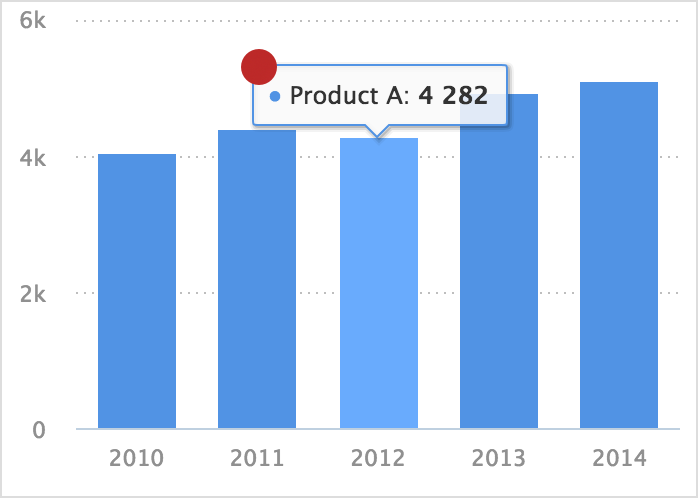
Tooltip
Tooltips appear when you hover your mouse over a chart region.
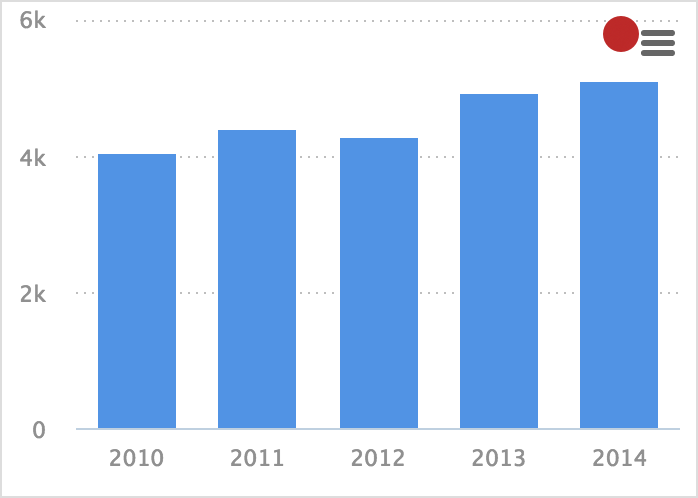
Download
The download button allows a chart to be exported as an image in various formats.
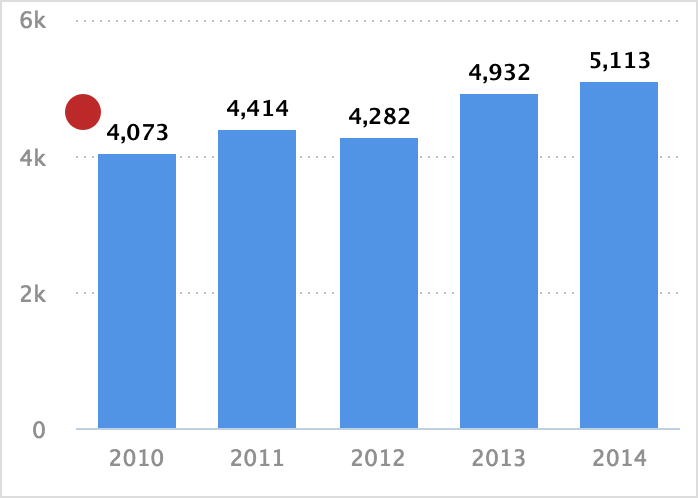
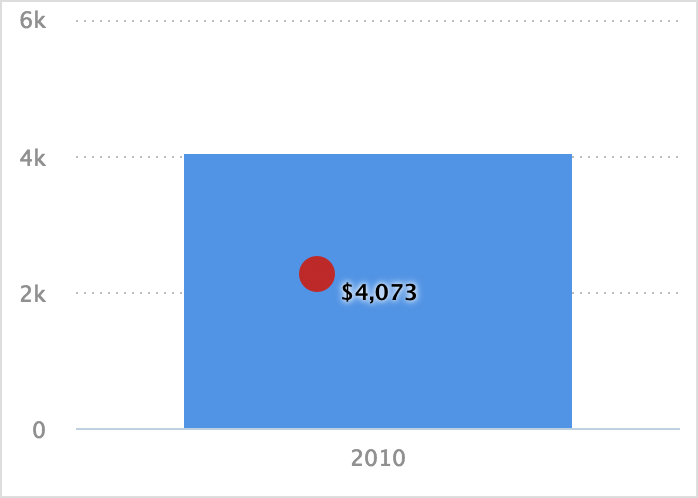
Data Labels
Data Labels show the data values for each data point. Then can be placed outside or inside the region and can be formatted.
Axis Titles
Chart axis can be assigned a title.
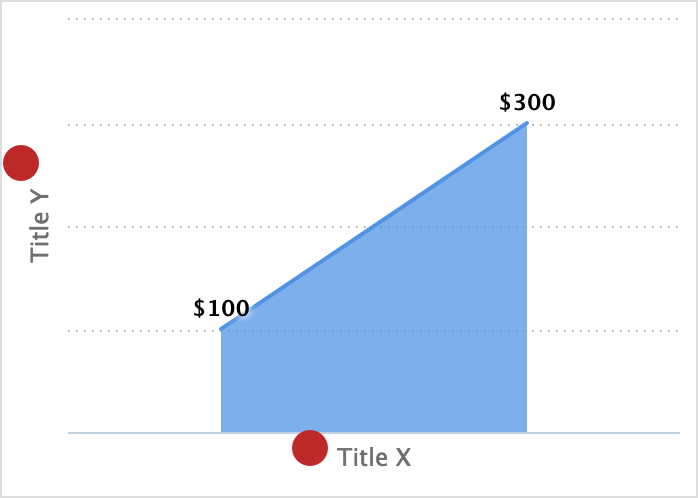
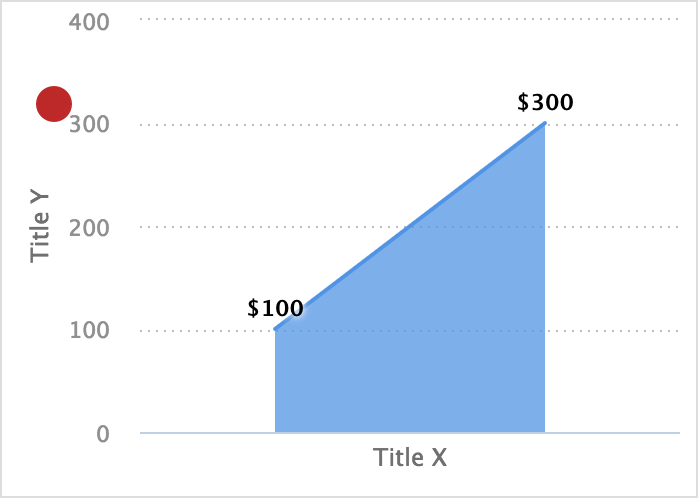
Axis Labels
Labels for each axis can be enabled or disabled.
Series
The series in a chart can be ordered and limited. In this chart the series are 2014 and 2015.
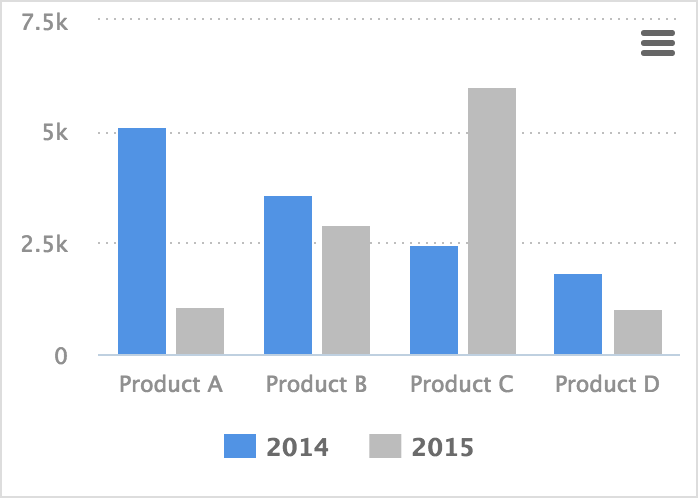
In this chart the series are ordered by name, so 2014 is first.
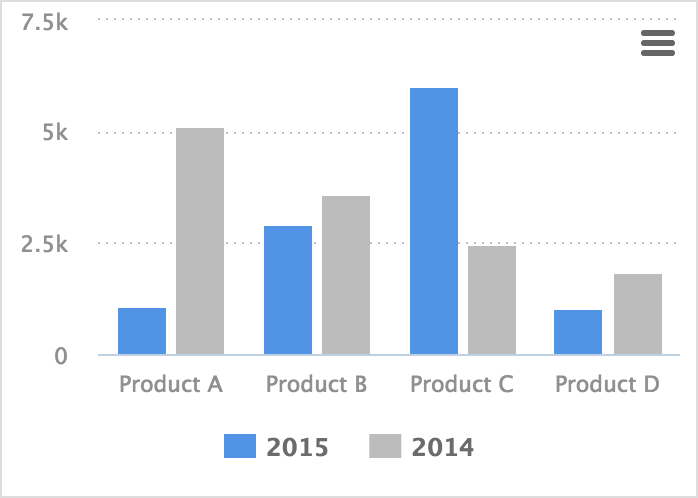
These series are ordered by the data values of Product A. Since 2015 is lower for Product A, it will appear first for all the series.
Chart Data Points
The data points in a chart can be ordered and limited.
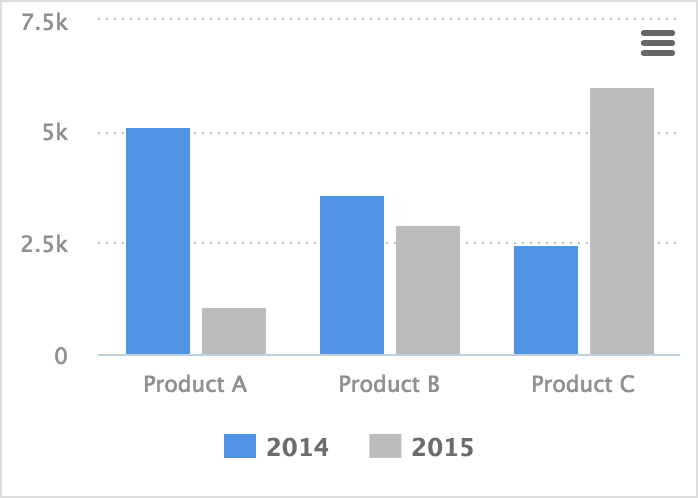
In this chart the data points are limited to 3, so each series has 3 columns, and the data for Product D is not shown.
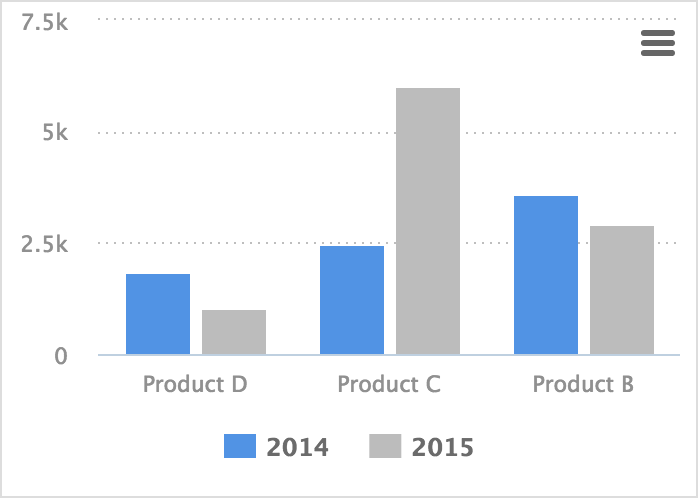
These data points are ordered by the data values of series 2014, and limited to 3 data points per series. Product A is not shown because it had the highest value in 2014.
Try Visual.is for Free!