A Comprehensive Guide on Business Dashboards

Decision making is one of the vital aspects of any company regardless of size. In addition to helping companies accomplish their goals within a defined timeline, good decisions guarantee their profitability and the satisfaction of employees. This is where business dashboards can actually help. Be they in the form of software applications, web-based apps or widgets, they provide a comprehensive view of metrics and important data which decision makers can use to make strategic plans for the present and future of their companies.

Online dashboard guide

What is a Business Dashboard?

According to, Stephen Fewa world leader in the field of data visualization, a dashboard is a“visual display of the most important information needed to achieve one or more objectives; consolidated and arranged on a single screen so the information can be monitored at a glance.”Taking their name from automobile dashboards, business dashboards share the same function: they summarize the events you cannot see under the hood (or across your organization) using visualizations. As a result, you can focus on navigating safely and with peace of mind.

Business dashboards are the most preferred business intelligence tools these days, a fact attributed to their cost-effectiveness, usability, efficiency, and ease of customization among other benefits. They are also the tool of choice for managers, senior executives and employees since they measure key performance indicators (KPIs) and metrics related to the company’s goals.

While their use has become more popular in current times, they were actually developed in the 1980s. At the time, they were known as Executive Information Systems (EISs). These management information systems provided senior executives and decision makers with easy access to external and internal information related to organizational goals. EISs relied on graphical displays and user interfaces to carry out strong reporting and help out in the manufacturing, marketing and finance areas. However, issues including system dependency, limited functionality, information overload, and high costs led to the demise of EIS and the rising popularity of business intelligence.

The Role of Dashboards in an Organization

You can use your business dashboard for the following purposes:

...Strategy– Once a company establishes strategies and tactics, managers can visualize and track their tactics with the help of strategy maps and scorecards. Modern, well-designed dashboards can be helpful in this regard, especially if they were effectively designed to display key performance-related charts and indicators as well. With time, these tools will help organizations focus on the most important performance-related activities and the factors which drive them.

...Planning– The main purpose of a dashboard is to enable managers to monitor, analyze and annotate. As a result, this software is linked strongly to planning and budgeting. For instance, executives can view, analyze and compare historical figures with forecasts, current budgets and targets. Similarly, they can monitor and share strategies and resource allocation figures across business units.

...Reporting– Because the software is designed for quicker decision making, displaying detailed reports may not be a common feature of dashboards. However, embedded links to reports can be part of a dashboard, offering more information for those who need more than charts and scorecards.

...Analytics– Most modern dashboards offer users important analytical features, such as heat maps, statistical analysis and data mining. As a result, they enable executives or managers to answer pressing questions from the dashboard interface without logging in to other software or analytical modules.

Types of Dashboards

There are three types of business dashboards which differ by area of use and the time employees spend on them.

Dashboard Types

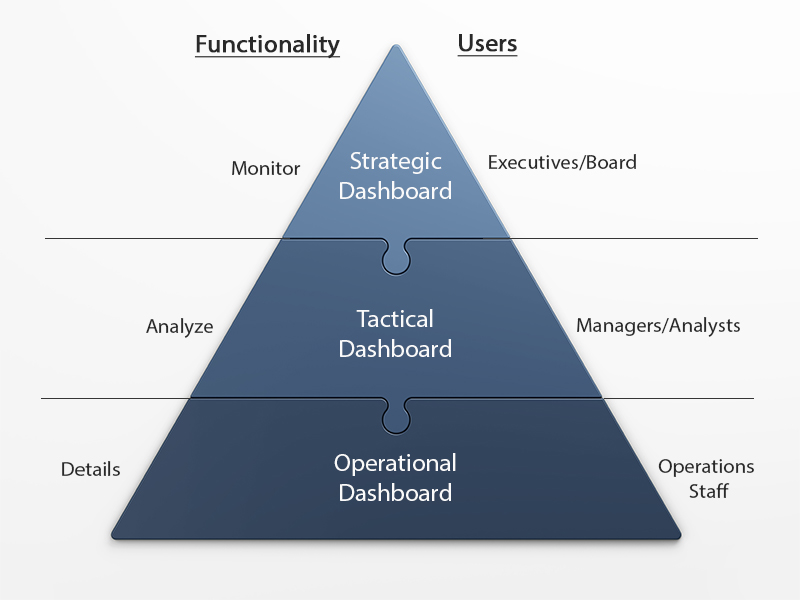
1) Strategic Dashboards

Used at the highest level of company management, strategic dashboards are designed with the balanced scorecard methodology in mind. Developed by David Norton and Robert Kaplan, this analysis technique is designed to create specific, quantifiable goals from an organization’s mission statement and business strategy. The method then allows its users to monitor performance in terms of achieving the company’s goals.

Strategic dashboards are used to monitor a company’s progress in achieving its predefined goals through relevant KPIs. For instance, for the sales department, dashboards record and track sales results, their trends and changes. Meanwhile, in the manufacturing department, production metrics are very important. Therefore, details such as product return date can identify positive and negative trends that can affect the company.

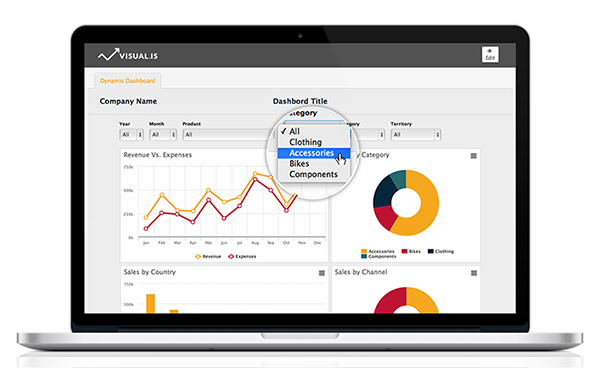
Business dashboards in this category also allow top level executives to see generalities first before delving into more detailed reports. To simplify the information and make it clear and transparent, increased data aggregation and graphic design are used.

2) Tactical Dashboards

Traditionally used by the middle management tier, tactical dashboards allow their users to assess the market’s reaction to their companies’ actions. However, some managers use this software internally, investigating how small changes or tasks influence their company as a whole. Regardless, users will get deeper insights into analyzed data and even solve problems by tracing their history and causes. Therefore, they can make better decisions which can improve a company’s stance in the present.

Unlike strategic dashboards, tactical ones are designed for more detailed purposes such as tracking trends related to the company’s goals and initiatives. For instance, a sales department using tactical dashboards won’t only see the totals, but also information regarding a product’s sale. Based on the information, sales managers can make decisions such as deciding to launch a product on a given date. On the other hand, quality is an important metric for the manufacturing department. Through their dashboard, supervisors can set regular quality review meetings among other related tasks.

3) Operational Dashboards

While the first two types of dashboards have a lot in common, operational dashboards significantly stand out. As their name suggests, they are used on an operational level in a given department, by its employees. As a result, they offer detailed insights, allowing their users to design work processes that increase benefits or revert trends. For instance, an operational dashboard in the sales department will allow employees to compare current sales with those from the month before. The software can also group sales data, identifying top salespeople and the best customers. As for the manufacturing department, comparing actual monthly production with target rates helps in identifying issues or opportunities.

The Case for Business Dashboards

Business dashboards have become an integral part in businesses of all sizes, especially since implementing them has become less expensive than ever before. If you are yet to step into the world of dashboards, the following advantages will assure you that you are making the right decision.


Dashboards for the Decision Making Process and Company Performance

The better the decisions you make for your company, the more it is bound to grow and become profitable. Dashboards provide decisive individuals with the best tools to support their jobs, especially through the following tasks:

  • Identifying Negative Trends\- In addition of activating and stimulating positive trends, effective management should detect and reduce negative trends. The latter is more important as localizing, analyzing and correcting these trends is essential for productivity and company morale.
  • Inventing Strategies According to Goals\- Dashboards support the decision-making procedure by providing timely and accurate information. By basing decisions on this information, better strategies will be developed and an improvement in the company’s performance will be noted.
  • Improving Analysis through Visualization Abilities\- Pure data will not necessarily identify and trace most irregularities. Luckily, what may not be visible in spreadsheets may be prominently displayed in graphic visualizations.
  • Measuring Company’s Parameters\- Measuring a company’s performance or levels of efficiency can be difficult, especially since the outside may not reflect what is going on within four walls. As dashboards support deep analysis, executives and managers alike will be able to detect inefficiencies and take action against them.

Dashboards’ Effect on Employee Efficiency

When used by employees, dashboards can boost their efficiency and productivity. This is mainly because this software automates analysis and reporting. Other benefits that impact employee efficiency include:

  • Saving Time\- In addition of activating and stimulating positive trends, effective management should detect and reduce negative trends. The latter is more important as localizing, analyzing and correcting these trends is essential for productivity and company morale.
  • Creating Interactive Reports\- Dashboards support the decision-making procedure by providing timely and accurate information. By basing decisions on this information, better strategies will be developed and an improvement in the company’s performance will be noted.

Dashboards’ Ability to Improve Employee Motivation

Dashboards can determine the most productive employees, allowing managers to give them raises and bonuses as a form of motivation. In addition, this software offers managers the following benefits:

  • Tracing Successful Trends\- By identifying and implementing successful trends, employees can become better at their jobs. As a result, they can grow more motivated and earn rewards from their employers.
  • Concentrating on Facts Rather than Forms\- Employees spending more time on reports and forms are bound to grow less motivated. Therefore, by allowing them to use the dashboard, you can double their interest in their work and reap the benefits of their newfound productivity.
  • Understanding Strategy Statements\- The most complex strategy will be easily understandable since it is presented in a transparent way. Due to the lack of ambiguity, employees will work according to the company’s goals and deliver beyond expectations.

Features of an Effective Dashboard

Companies get to decide what features their dashboards should have according to their needs and procedures. However, at the most basic level, business dashboards share the following common features.


Data Visualizations

One of the important parts of your business dashboard is data visualizations. These are graphical representations that are used to simplify the transmission of complex information, making it easier for the user to spot trends quickly. The best dashboards use the following types of data visualization among others:

...

Gauges– Gauges are an integral part of any dashboard, be it an automobile’s or a company’s. They allow you to find out information about a single value such as the company’s target.

...

Widgets– Widgets are defined as the basic unit of graphical information. They highlight an indicator or a number, allowing you to notice that very important value easily.

...

Line Charts– A line chart is created by connecting a series of data points, each of which depicts an individual measurement and show the development of a value over time.

...

Column Charts– A traditional data representation method, column charts allow users to compare relative values by displaying metric values in the form of columns originating from zero.

...

Tables– Because of their common use in businesses, tables will be more familiar with dashboard users. They also provide more details than other items on this list.

...

Text– Text visualization adds another dimension to data mining, especially if you need to go through long, detailed reports. It can help you analyze the overall theme of the report.


Intuitive Interface and Navigation

Dashboards are designed to offer information quickly, which is why their interfaces should be easy to understand. Easy navigation is also a bonus since it makes the interface easier to switch through, especially during presentations and board meetings.


Dynamic Visualizations

Dashboards should easily adapt to change and show data dynamically. This is usually possible through customizable filters such as Year, Product, Category or Order Quantity. Again, this can be beneficial during business meetings as well as on the production floor.


Data Manipulation

In addition to processing data from your database or files, the dashboard will allow you to create or edit data that it can use. This feature is especially valuable for detecting future trends or crunching numbers on the fly.


Quick Diagnosis

A good business dashboard should support quick problem diagnosis. The data presentation needs to directly indicate the likely source of a problem. This is especially true if you are integrating dashboards for top level executives (strategic dashboards).

The Golden Rules of Designing Business Dashboards

In order to create an effective dashboard that promotes action and creates important changes, all you need is a professional developer. However, before hiring one, consider the following guidelines for designing business dashboards.

  • Communication is the Main Objective– Dashboards should not only be visually appealing, but they should also facilitate quick and clear communication to enable better, faster decision-making.
  • Information Should Be Fitted in One Screen without Sacrificing Meaning– All relevant reports and information should be displayed on a single screen without compromising clarity. Only then can the software ensure faster data inspection and understanding. In fact, cognitive research has uncovered that visualizing all unrelated information sources together helps individuals and allows them to detect significance and grasp the overall meaning of the information. On the other hand, if you need more details, consider a tabbed dashboard or one that supports hyperlinks.
  • Customization is Essential– Reports and visualizations need to be customized to match specific needs and demands. Without this feature, the dashboard will not be relevant, thus, incapable of appropriate and timely decision-making.
  • Be Thorough While Defining Metrics– Your dashboard should have high level performance metrics, especially those related to the company’s goals. Similarly, metrics should focus on actionable data and originate from different sources.
  • Use Color Sparingly\- Investing in colors may not be worthwhile, especially since 7% of men color blind. However, you should use colors sparingly, especially since different colors can create different meanings. Just remember to use a single hue and increase intensity according to low to high values.
  • Choose the Best Visualizations not the Best Looking Ones– Your dashboard’s visualizations should be intuitive and immediately understandable to convey the intended meaning and communicate messages without using up screen space. They should also be devoid of distracting imagery to efficiently communicate significant data.
  • Enable Users to Take ActionUsers should be provided with options to share the new information with others and drive resultant action. For instance, the dashboard can include email or support for comments and discussion threads.

Conclusion

As you can see, business dashboards are powerful tools that can complement your business and push it to succeed. However, you need to abide by the best design practices and integrate essential features for your business to truly make this tool useful. You can also entrust this task to a professional company to tap into their experience and expertise and get a robust dashboard for your organization.

Dashboard Types